Posted At: Aug 15, 2025 - 795 Views
Turning Data into Insights: A Comprehensive Guide
In today’s data-driven world, businesses and organizations generate vast amounts of information daily. However, raw data alone holds little value until it is transformed into actionable insights that drive strategic decisions. This blog explores the process of turning data into insights, offering practical steps, tools, and examples to help you unlock the potential of your data.
What Are Actionable Insights?
Actionable insights are data-driven findings that lead to specific, meaningful actions. Unlike raw data or general analytics, actionable insights provide clear guidance for decision-making, enabling businesses to achieve measurable outcomes. For example:
- Identifying sales patterns to optimize inventory management.
- Pinpointing marketing channels with the highest ROI.
- Detecting anomalies in financial transactions to prevent fraud.
Steps to Turn Data into Insights
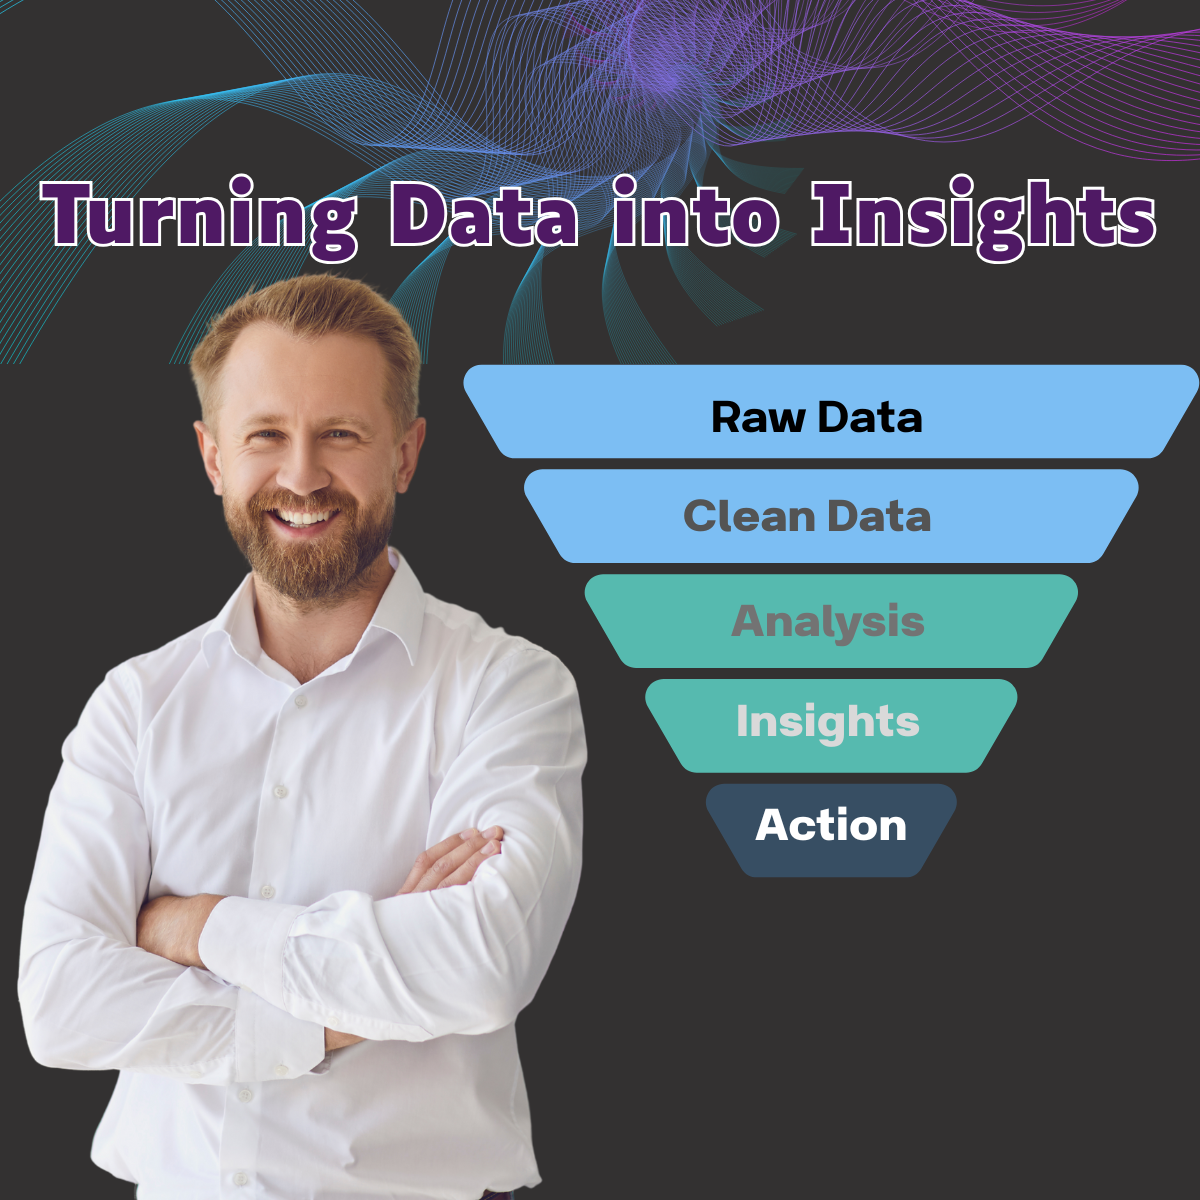
Transforming data into actionable insights requires a systematic approach. Below are key steps to guide this process:
1. Define Business Goals
Start by identifying specific and measurable objectives aligned with your organization’s priorities. Clear goals ensure that your analysis focuses on solving relevant problems. Examples include:
- Improving production efficiency.
- Enhancing customer engagement through personalized recommendations.
- Reducing operational costs by identifying inefficiencies.
2. Gather and Evaluate Data Sources
Reliable insights depend on high-quality data. Begin by assessing the accuracy, completeness, and relevance of your current datasets. Integrate data from multiple sources (e.g., CRM systems, transactional databases) and clean it to remove duplicates or errors. Consider expanding your data collection methods to capture untapped opportunities.
3. Use the Right Tools
The tools you choose play a critical role in analyzing and visualizing your data. Depending on your needs, options range from basic spreadsheets like Excel to advanced analytics platforms such as Tableau, Power BI, and Zoho Analytics. These tools offer features like AI-driven insights, real-time dashboards, and natural language queries for easier exploration.
4. Analyze Data for Patterns
Leverage analytics platforms or machine learning models to uncover trends and correlations in your datasets. For example:
- In e-commerce, analyzing customer behavior can reveal opportunities for personalized marketing.
- In healthcare, identifying patterns in patient outcomes can improve treatment strategies.
5. Create Dashboards
Present your findings using intuitive dashboards tailored to end-user needs. Effective dashboards highlight key metrics with clear visualizations (e.g., charts, graphs) that make trends and anomalies easy to spot. Interactive elements allow users to drill down into specific data points for deeper analysis.
6. Test and Iterate
Before implementing changes based on insights, test them through controlled experiments such as A/B testing or pilot programs. Monitor results closely and refine your approach as needed to ensure success.
Tools for Turning Data into Insights
Here are some powerful tools that can help streamline the process:
Tool | Key Features | Ideal Users |
Tableau | AI-driven visualizations; interactive dashboards | Business analysts |
Power BI | Automated machine learning; anomaly detection | Enterprises |
Zoho Analytics | AI-powered data preparation; real-time reports | Small-medium businesses |
ThoughtSpot | Natural language queries; real-time monitoring | Non-technical users |
Sisense | Advanced collaboration; dynamic visualizations | Technical developers |
These tools simplify complex analyses and make insights accessible across teams.
Real-World Examples
To illustrate the power of actionable insights, here are some examples:
- E-commerce Optimization
An online retailer aggregated customer behavior data from multiple platforms using ETL tools. By standardizing this data and enriching it with attributes like purchase frequency, they created personalized marketing campaigns that boosted engagement and sales. - Fraud Detection in Financial Services
A financial firm transformed transactional data into formats suitable for machine learning models. This enabled real-time anomaly detection, reducing fraud-related losses while maintaining customer trust. - Healthcare Analytics
Hospitals integrated patient records from various systems into unified profiles using analytics platforms like dbt Cloud. This allowed them to predict outcomes and optimize staffing needs based on admission rates.
Best Practices for Insight Generation
To ensure successful outcomes from your data initiatives:
- Prioritize Findings: Focus on insights with the highest potential impact.
- Enhance Data Literacy: Train teams on interpreting dashboards and reports accurately.
- Collaborate Across Teams: Involve stakeholders early to align insights with business goals.
- Invest in Scalable Tools: Choose platforms that grow with your organization’s needs.
Conclusion
Turning data into actionable insights is not just about technology—it’s about asking the right questions, defining clear goals, and leveraging tools effectively. By following these steps and embracing best practices, organizations can unlock the true value of their data to drive innovation and achieve strategic growth.